A girl brought her boy friend home to meet her parents. After dinner, her mother told the father to find out about the young man. So he invited the boy to his study for tea.
"So what are your plans?" the father asked the boy.
"I am a religious scholar and I want to marry your daughter" he replied.
"A scholar!" the father said, "That's admirable, but what will you do to provide a nice and comfortable house for my daughter to live in?"
"I will study," the young man replied, "and God will provide for us."
"What are your plans for your future living with my daughter?" the father continued to ask.
"I will concentrate on my studies," the young man replied, "God will provide for us."
"And how will you buy her a beautiful engagement ring, such as she deserves?" asked the father.
"No worries," the young man replied, "God will provide for us."
"And children?" asked the father, "What about the children?"
"Don't worry, sir, I'm sure God will provide for us." replied the boy.
So the conversation continued, and finally the mother came in, took the father away and asked, "How did it go?"
The father answered, "He has no job. He has no plans. He knows only one thing; he thinks I'm God."
Monday, November 18, 2013


Friday, November 1, 2013
0, 1 and Infinity
Quiz - "Can you walk 1 mile south, then walk 1 mile east and finally walk 1 mile north to end up where you started?"
Answers:
1. No. We need to walk 1 mile west to come back to where we started.
Begin from the starting point A, walk 1 mile south to point P. Then walk 1 mile east to point Q. Finally, walk 1 mile north to point B. We are still 1 mile east of A where we started.
 2. Yes, when we are at North Pole.
At North Pole N, any direction will head south. So just choose one and walk 1 mile to get to point P. Then walk 1 mile east to get to point Q. Finally, walk 1 mile north to get back to North Pole N where we started.
 3. Yes, there are infinitely many places we can do so.
There is a circle with circumference of 1 mile around the South Pole S. From any point Q on this circle, we can walk east for 1 mile encircling the South Pole S once to get back to Q. 1 mile north of Q, we can find a place P.
Now, starting from place P, walk 1 mile south to get to point Q. Then walk 1 mile east encircling the South Pole S once to get back to Q. Finally, walk 1 mile north to get back to P where we started. Since Q is an arbitrary point on the circle, P is also arbitrary. Hence there are infinitely many places of P we can do so.

Answers:
1. No. We need to walk 1 mile west to come back to where we started.
Begin from the starting point A, walk 1 mile south to point P. Then walk 1 mile east to point Q. Finally, walk 1 mile north to point B. We are still 1 mile east of A where we started.

At North Pole N, any direction will head south. So just choose one and walk 1 mile to get to point P. Then walk 1 mile east to get to point Q. Finally, walk 1 mile north to get back to North Pole N where we started.

There is a circle with circumference of 1 mile around the South Pole S. From any point Q on this circle, we can walk east for 1 mile encircling the South Pole S once to get back to Q. 1 mile north of Q, we can find a place P.
Now, starting from place P, walk 1 mile south to get to point Q. Then walk 1 mile east encircling the South Pole S once to get back to Q. Finally, walk 1 mile north to get back to P where we started. Since Q is an arbitrary point on the circle, P is also arbitrary. Hence there are infinitely many places of P we can do so.

Furthermore, we can find a circle with circumference of 1/2 mile around the South Pole S. From any point Q on this circle, we can walk 1 mile east encircling the South Pole twice to get back to Q. From Q, find place P as above. Likewise, we can find circles of circumferences of 1/3 mile, 1/4 mile and 1/5 mile etc. around the South Pole S and from any point Q on the circles, walk 1 mile east encircling the South Pole S 3 times, 4 times and 5 times etc respectively to get back to Q. Thus theoretically, we have infinitely many circles and infinitely many points Q, and hence infinitely many places of P we can do so.
Tuesday, October 22, 2013
酒干倘賣無
《酒干倘賣無》閩南語是
“有空酒瓶賣嗎?“
一個跛腳的老人靠收集空酒瓶養活自己,老人有些聾啞,不會說話,孤單的一個人,生活夠苦的了。有一天他在街上撿到一個孩子,他欣喜異常,認為是上天賜給他唯一的禮物。老人將孩子帶回家,用辛苦收來的空酒瓶,換錢買廉價的奶粉,讓那個小女孩活了下來,女孩在6歲的時候撿了一條小狗,取名旺才。小狗,聾啞老人,小女孩相依為命地生活在一起,小女孩的童年就在那一堆如山的空酒瓶中成長。
天生的好嗓子讓她成為聾啞人的傳話機,在每個清晨女孩牽著老人,拄著拐杖。女孩大聲的喊著:"酒干倘賣無、酒干倘賣無" ..... 再後來,小女孩長大了,戀愛了,她愛上了一個作詞家。年青的作詞家一窮二白,但很愛她,帶她走進了藝術天地,為她寫了很多歌,對老人也非常好,每次來都會幫老人運酒瓶,和老人比劃著說話,逗旺才.....
然而有一天,女孩成名了,生活發生了質的變化,房子,汽車,周圍追求的人......女孩還是很愛男孩,勸他和她一起住進大別墅,不要回酒瓶屋了,因為又聾又啞的父親,讓她覺得羞辱!男孩不願意,仍和老人來往,後來女孩越來越忙,名氣越來越大,生活完全由經濟人安排。老人想念女兒,央求男孩帶他去找女兒,但是還沒進演唱會的大門就被哄出來了...... 再後來女孩也煩了,丟給老頭一筆錢讓他不要再打擾,老人擦乾了含淚的眼睛,沒要女孩的一分錢,走時還留下女孩一直愛吃的一小袋松子!
男孩看不過去了,找女孩理論,女孩心裡聽不進任何勸言,因為兩人地位懸殊,最終只能分手。但老人因思念女孩終於病倒了,男孩只好央求女孩,希望她能回家看看老人,女孩沒聽他的!就在這時,男孩打聽到女孩唱歌的地方,他告訴了老人,老人掙扎著要去看女兒最後一面。不料走在路上,一輛卡車飛馳過來,眼看就要撞著老人了,老狗旺才猛地拱向了老人,旺才就這樣死了.....
男孩知道後決定為女孩寫最後一首歌,他連夜趕,頂著長期的貧困和思念,在他身體快不行的時候,寫下了這首歌,讓人送給了那個女孩。男孩寫完歌詞後也離開了人世間,演唱會上女孩不情願地打開紙條,看著這首歌的歌詞:
多麼熟悉的聲音
陪我多少年風和雨
從來不需要想起
陪我多少年風和雨
從來不需要想起
永遠也不會忘記
沒有天哪有地
沒有地哪有家
沒有家哪有你
沒有你哪有我
假如你不曾養育我
給我溫暖的生活
假如你不曾保護我
我的命運將會是什麼
是你撫養我長大
陪我說第一句話
是你給我一個家
讓我與你共同擁有它
雖然你不能開口
說一句話
卻更能明白人世間的
黑白與真假
雖然你不會表達你的真情
卻付出了
熱忱的生命
遠處傳來你
多麼熟悉的聲音
讓我想起你
多麼慈祥的心靈
什麼時候
你再回到我身旁
讓我再和你一起唱
酒干倘賣無
酒干倘賣無...........
多年前的往事一一在現,堆積如山的空酒瓶,聾啞的父親,為了給她買一包松子累暈在酷暑的街頭,還有小狗旺才拖著尾巴和她玩耍! ...... 女孩哭了,她終於良心發現,愧疚,傷心,不安!她反復學著這首歌,最後登台的時候,她通知樂隊加最後一首歌《酒干倘賣無》。
女孩忘情地唱著,台下所有的人震驚了,所有的人都流下了眼淚,女孩在台上講述了自己的身世,然後不顧一切地跑向了醫院,她要見自己的父親。當老人看到女兒時,一行老淚緩緩從腮邊流下,老人甚麼也說不出口,只是微笑的看著女兒,慢慢的閉上了眼睛,女孩撕心裂肺的哭喊著,泣不成聲.............
這就是《酒干倘賣無》的故事...... 獻給所有的年輕人!
也許,我們的父母,不曾帶給我們優越的環境,但是他們卻盡最大的能力,把我們養大,把他們最好的時光和經歷都給了我們。從呱呱墜地到咿呀學語,從慢慢會爬到漸漸行走,再到長大成人,他們付出了畢生經歷和心血。
好好愛我們的父母吧,父母的養育恩,我們一輩子也報答不完........
(source : http://www.youtube.com/watch?v=I3UeCqprHC8)
Friday, October 11, 2013
HSC and ATAR (10 of 10) - Bonus Points
Some universities may award bonus points to students for admissions to particular courses based on criteria whether the student:
1. lives in and attend school in remote rural or regional areas
2. performs well in particular HSC courses
3. excels in extra-curricular activities in leadership, academia, sport, music or performance
4. is affected by circumstances beyond his control e.g. prolonged illness, disability, financial hardship, language difficulty or sudden education disruption etc.
Bonus points will not change the student's ATAR, but will change his selection rank for a particular course in a particular university. e.g. If a student has an ATAR of 89.00 and, with certain criteria, he is awarded 2 bonus points, then his selection rank becomes 91.00. The student may get an offer for admission to a course with ATAR cut-off less than or equal to 91.00 in that particular university.
Most bonus points are automatically allocated as part of the application process for university entrance. Some bonus points require a direct application to that particular university.
As schemes for bonus points vary from university to university, and from course to course, students are advised to check with individual university's website for details.
Following are some examples of bonus points:
A. Bonus points based on HSC performance:
University of New South Wales (2013) - B. Commerce
 B. Bonus points based on extra-curricular activities:
University of New South Wales (2014)

1. lives in and attend school in remote rural or regional areas
2. performs well in particular HSC courses
3. excels in extra-curricular activities in leadership, academia, sport, music or performance
4. is affected by circumstances beyond his control e.g. prolonged illness, disability, financial hardship, language difficulty or sudden education disruption etc.
Bonus points will not change the student's ATAR, but will change his selection rank for a particular course in a particular university. e.g. If a student has an ATAR of 89.00 and, with certain criteria, he is awarded 2 bonus points, then his selection rank becomes 91.00. The student may get an offer for admission to a course with ATAR cut-off less than or equal to 91.00 in that particular university.
Most bonus points are automatically allocated as part of the application process for university entrance. Some bonus points require a direct application to that particular university.
As schemes for bonus points vary from university to university, and from course to course, students are advised to check with individual university's website for details.
Following are some examples of bonus points:
A. Bonus points based on HSC performance:
University of New South Wales (2013) - B. Commerce

University of New South Wales (2014)

Monday, September 23, 2013
數學不好的好處
Recently I read a following article:
"數學不好的好處"
1. 數學不好的人都比較愛笑, 因為沒有數學就沒有煩惱.
2. 數學不好的人都比較天真浪漫, 比較感性.
3. 數學不好的人都比較幽默, 生活充滿樂趣, 感情和想像力都比較豐富.
4. 數學不好的人都比較直爽, 實在, 不會拐彎抹角.
5. 數學不好的人長得都比較漂亮.
只有一個缺點 ...... 就是數學不好!!
Negating the negatives, we have:
"數學好的壞處"
1. 數學好的人都比較不懂得笑, 因為有了數學就煩惱多多.
2. 數學好的人都比較正經實際, 比較理性.
3. 數學好的人都比較嚴肅, 生活缺乏樂趣, 感情和想像力都比較平淡.
4. 數學好的人都比較保守, 虛偽, 時常拐彎抹角.
5. 數學好的人長得都比較平凡.
只有一個優點 ...... 就是數學好 !!
OMG !!!
"數學不好的好處"
1. 數學不好的人都比較愛笑, 因為沒有數學就沒有煩惱.
2. 數學不好的人都比較天真浪漫, 比較感性.
3. 數學不好的人都比較幽默, 生活充滿樂趣, 感情和想像力都比較豐富.
4. 數學不好的人都比較直爽, 實在, 不會拐彎抹角.
5. 數學不好的人長得都比較漂亮.
只有一個缺點 ...... 就是數學不好!!
Negating the negatives, we have:
"數學好的壞處"
1. 數學好的人都比較不懂得笑, 因為有了數學就煩惱多多.
2. 數學好的人都比較正經實際, 比較理性.
3. 數學好的人都比較嚴肅, 生活缺乏樂趣, 感情和想像力都比較平淡.
4. 數學好的人都比較保守, 虛偽, 時常拐彎抹角.
5. 數學好的人長得都比較平凡.
只有一個優點 ...... 就是數學好 !!
OMG !!!
Thursday, September 12, 2013
HSC and ATAR (9 of 10) - Calculation of the ATAR
Aggregate
After the scaling process is complete, it is now possible to add the scaled marks together. To determine the aggregate, 10 units of ATAR courses are chosen comprising:
. the best 2 units of English
. the best 8 units from the remaining courses, which can include up to 2 units of Category B courses
Basing on Alex's scaled marks, his aggregate is calculated as follows:
Scaled Total
Course mark Unit mark
English Advanced 41.8 2 83.6
History Ext. 45.4 1 45.4
Maths Ext. 2 42.8 2 85.6
Economics 42.5 2 85.0
Maths Ext. 1 37.2 2 74.4
Modern History 24.9 1 24.9
Aggregate 10 398.9
ATAR Percentile
With the aggregate calculated, the ATAR percentile which shows the position of the student relative to his ATAR cohort (i.e. Year 12 students eligible for an ATAR) is determined. Following is a table of the ATAR percentile corresponding to some selected aggregate in 2012 (as shown in Report of the Scaling of the 2012 NSW HSC by BOS):
Aggregate ATAR Percentile
450.0 98.8
400.0 91.1
350.0 77.0
300.0 60.1
250.0 42.9
200.0 26.7
150.0 13.7
As can be seen from the table, Alex's aggregate of 398.9 is close to the 91.1-percentile. His actual ATAR percentile may have been calculated as 90.9 (i.e. Alex's position in the HSC is higher than 90.9% of all other students).
Year 7 Percentile
Next, the Year 7 percentile which shows the position of the student relative to his Year 7 cohort is determined. This is done by incorporting the number of students who had started Year 7 study at the same time with the student but do not complete their study in Year 12. From the Australian Bureau of Statistics (ABS), a comparison can be made between the size of the Year 12 cohort in 2012 and that of the Year 7 cohort in 2007. Statistics shows that there are early school leavers of 6,739. As these 6,739 students virtually receive no marks in the HSC, it can be expected the Year 7 percentile would be higher than the corresponding ATAR percentile (i.e. the student's performance will be better than more other students including the early school leavers). Following is a table of the Year 7 percentils corresponding to the ATAR percentile in 2012 (as shown in Report of the Scaling of the 2012 NSW HSC by BOS):
ATAR Percentile Year 7 Percentile
99.0 99.4
90.0 94.1
80.0 88.2
70.0 82.1
60.0 76.0
50.0 69.6
40.0 62.8
30.0 55.3
20.0 46.5
15.0 41.5
As can be seen from the table, Alex's ATAR percentile of 90.9 is close to 90.0 (corresponding to a Year 7 percentile of 94.1). His actual Yeat 7 percentile may have been calculated as 94.24 (i.e. Alex's position in the HSC is higherr than 94.24% of all other students starting Year 7 together with him).
The ATAR
The final step for calculating the ATAR is just to truncate the Year 7 percentile to the nearest 0.05. In so doing, Alex's ATAR is 94.25.
After the scaling process is complete, it is now possible to add the scaled marks together. To determine the aggregate, 10 units of ATAR courses are chosen comprising:
. the best 2 units of English
. the best 8 units from the remaining courses, which can include up to 2 units of Category B courses
Basing on Alex's scaled marks, his aggregate is calculated as follows:
Scaled Total
Course mark Unit mark
English Advanced 41.8 2 83.6
History Ext. 45.4 1 45.4
Maths Ext. 2 42.8 2 85.6
Economics 42.5 2 85.0
Maths Ext. 1 37.2 2 74.4
Modern History 24.9 1 24.9
Aggregate 10 398.9
ATAR Percentile
With the aggregate calculated, the ATAR percentile which shows the position of the student relative to his ATAR cohort (i.e. Year 12 students eligible for an ATAR) is determined. Following is a table of the ATAR percentile corresponding to some selected aggregate in 2012 (as shown in Report of the Scaling of the 2012 NSW HSC by BOS):
Aggregate ATAR Percentile
450.0 98.8
400.0 91.1
350.0 77.0
300.0 60.1
250.0 42.9
200.0 26.7
150.0 13.7
As can be seen from the table, Alex's aggregate of 398.9 is close to the 91.1-percentile. His actual ATAR percentile may have been calculated as 90.9 (i.e. Alex's position in the HSC is higher than 90.9% of all other students).
Year 7 Percentile
Next, the Year 7 percentile which shows the position of the student relative to his Year 7 cohort is determined. This is done by incorporting the number of students who had started Year 7 study at the same time with the student but do not complete their study in Year 12. From the Australian Bureau of Statistics (ABS), a comparison can be made between the size of the Year 12 cohort in 2012 and that of the Year 7 cohort in 2007. Statistics shows that there are early school leavers of 6,739. As these 6,739 students virtually receive no marks in the HSC, it can be expected the Year 7 percentile would be higher than the corresponding ATAR percentile (i.e. the student's performance will be better than more other students including the early school leavers). Following is a table of the Year 7 percentils corresponding to the ATAR percentile in 2012 (as shown in Report of the Scaling of the 2012 NSW HSC by BOS):
ATAR Percentile Year 7 Percentile
99.0 99.4
90.0 94.1
80.0 88.2
70.0 82.1
60.0 76.0
50.0 69.6
40.0 62.8
30.0 55.3
20.0 46.5
15.0 41.5
As can be seen from the table, Alex's ATAR percentile of 90.9 is close to 90.0 (corresponding to a Year 7 percentile of 94.1). His actual Yeat 7 percentile may have been calculated as 94.24 (i.e. Alex's position in the HSC is higherr than 94.24% of all other students starting Year 7 together with him).
The ATAR
The final step for calculating the ATAR is just to truncate the Year 7 percentile to the nearest 0.05. In so doing, Alex's ATAR is 94.25.
Friday, August 23, 2013
HSC and ATAR (8 of 10) - Scaling of HSC Marks
Alex's HSC result as reported in his Record of Achievement is as follows:
Exam Assessment HSC Performance
Course Unit mark mark mark band
Economics 2 85/100 92/100 89 5
English Advanced 2 83/100 96/100 90 6
Maths Ext. 1 2 75/100 80/100 78 4
Maths Ext. 2 2 80/100 88/100 84 5
Modern History 2 74/ 100 76/100 75 4
History Ext. 1 46/50 47/50 47 E4
Marks in different courses are usually not comparable due different nature of the courses. Let's get some idea from Alex's HSC marks and his performance against other students in his Economics and Mathematics Extension 2 courses (from Alex's HSC result and the statistics on percentiles in Table A3 in the Report of the Scaling of the 2012 NSW High School Certificate):
HSC
Course Unit mark Percentile
Economics 2 89 90
Maths Ext. 2 2 84 48
As can be seen, while Alex's HSC marks for Economics and Mathematics Extension 2 only differ by 5 (89 vs 84), his position in Economics is much higher than that in Mathematics Extension 2 (90-percentile vs 48-percentile) when compared against other students. (i.e.Despite similar marks, Alex's performance in Economics is better than 90% of all other students in Economics while his performance in Mathematics Extension 2 is only better than 48% of all other students in this course). This implies that most students taking the Mathematics Extension 2 course perform very well while those taking Economics do less well comparatively. In other words, the strength of performance of the course candidature in Mathematics Extension 2 is higher than that of Economics. As such, similar marks in different courses do not necessarily mean similar performance due differences in strength of students in each course. As the ultimate determination of ATAR is to rank the students according to their academic performance (i.e. academic strength) for selection to universities, marks from different courses cannot be simply added together as an aggregate to derive the ATAR. Some form of adjustment called scaling must be carried out to convert marks from different courses (HSC marks) into marks in a common scale (scaled marks) based on the strength of performance of the course candidature before they can be compared and added. As an analogy, we cannot add apple to orange. But instead, we can convert them into a common scale (called fruit) before meaningful addition can take place.
Calculating scale means and standard deviations of ATAR courses
The scaling process first converts the HSC marks of all courses to marks on a 1-unit basis. Then it calculates the scaled mean and scaled standard deviation of each course to reflect the strength of the course candidature.
Take Mathematics Extension 2 as an example. There are 3,454 candidates in 2012. Each of these 3,454 students may take a number of other courses in the HSC examination. e.g. Student A may also take Economics, English Advanced, Maths Ext. 1, Modern History and History Extension. Student B may also take English Advanced, English Ext. 1, Legal Studies, Maths Ext. 1 and Physics, and so on. The scaling process takes the HSC marks of all the courses taken by all these 3,454 students as a sample. Thus this sample contains all the HSC results of all the students taking Mathematics Extension 2, and hence represents the strength of performance of all the candidates in this course. The mean and the standard deviation of this sample are then determined as the scaled mean and scaled standard deviation of Mathematics Extension 2. In conjunction, the scaled maximum mark and various percentiles are also determined from the sample.
Following is an extract of some ATAR courses from Table A3 in the Report on the Scaling of the 2012 NSW High School Certificate, which shows their calculated scaled means, standard deviations, maximum marks and various percentiles.
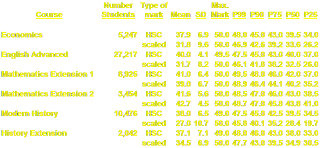 It should be noted that:
1. scaled mean - As students taking harder courses tend to perform better in their other courses, HSC marks in the sample for harder courses like Mathematics Extension 2 is expected to be relatively higher and so does the scaled mean. Hence, the larger the scaled mean, the better the scaled marks will be on average.
2. scaled standard deviation - The standard deviation indicates the spread of marks which deviates from the mean. Marks in courses with a low scaled standard deviation are generally closer to the scaled mean. Hence, there is less variation in scaled marks in different percentiles (e.g. in Mathematics Extension 2, scaling for P50 is not too different from that of P90. Student with a fair ranking can also have a reasonably good scaled mark). On the other hand, marks in courses with a high scaled standard deviation are more wide-spread. Only marks in higher percentile are better scaled while those in lower percentile will be poorly scaled (e.g. in Modern History, scaling in P50 is much poorer than that of P90. Student has to achieve a high ranking in order to have a good scaled mark)
Scaling individual HSC marks
Alex's HSC mark for Economics is 89 which is 44.5 on a 1-unit basis, and falls close to the 90-percentile (P90). His scaled mark is then expected to be close to 42.6. The scaling process may have calculated his scaled mark to be 42.5. Likewise, scaled marks for Alex's other courses are calculated in similar manner. Alex's scaled marks would have been calculated from the corresponding HSC marks as follows:
HSC scaled
Course mark 1-unit mark
Economics 89 44.5 42.5
Englisg Advanced 90 45.0 41.8
Maths Ext. 1 78 39.0 37.2
Maths Ext. 2 84 42.0 42.8
Modern History 75 37.5 24.9
History Ext. 47 47.0 45.4
In like manner, all students' HSC marks are scaled accordingly and ready to be aggregated for the determination of ATARs.
Exam Assessment HSC Performance
Course Unit mark mark mark band
Economics 2 85/100 92/100 89 5
English Advanced 2 83/100 96/100 90 6
Maths Ext. 1 2 75/100 80/100 78 4
Maths Ext. 2 2 80/100 88/100 84 5
Modern History 2 74/ 100 76/100 75 4
History Ext. 1 46/50 47/50 47 E4
Marks in different courses are usually not comparable due different nature of the courses. Let's get some idea from Alex's HSC marks and his performance against other students in his Economics and Mathematics Extension 2 courses (from Alex's HSC result and the statistics on percentiles in Table A3 in the Report of the Scaling of the 2012 NSW High School Certificate):
HSC
Course Unit mark Percentile
Economics 2 89 90
Maths Ext. 2 2 84 48
As can be seen, while Alex's HSC marks for Economics and Mathematics Extension 2 only differ by 5 (89 vs 84), his position in Economics is much higher than that in Mathematics Extension 2 (90-percentile vs 48-percentile) when compared against other students. (i.e.Despite similar marks, Alex's performance in Economics is better than 90% of all other students in Economics while his performance in Mathematics Extension 2 is only better than 48% of all other students in this course). This implies that most students taking the Mathematics Extension 2 course perform very well while those taking Economics do less well comparatively. In other words, the strength of performance of the course candidature in Mathematics Extension 2 is higher than that of Economics. As such, similar marks in different courses do not necessarily mean similar performance due differences in strength of students in each course. As the ultimate determination of ATAR is to rank the students according to their academic performance (i.e. academic strength) for selection to universities, marks from different courses cannot be simply added together as an aggregate to derive the ATAR. Some form of adjustment called scaling must be carried out to convert marks from different courses (HSC marks) into marks in a common scale (scaled marks) based on the strength of performance of the course candidature before they can be compared and added. As an analogy, we cannot add apple to orange. But instead, we can convert them into a common scale (called fruit) before meaningful addition can take place.
Calculating scale means and standard deviations of ATAR courses
The scaling process first converts the HSC marks of all courses to marks on a 1-unit basis. Then it calculates the scaled mean and scaled standard deviation of each course to reflect the strength of the course candidature.
Take Mathematics Extension 2 as an example. There are 3,454 candidates in 2012. Each of these 3,454 students may take a number of other courses in the HSC examination. e.g. Student A may also take Economics, English Advanced, Maths Ext. 1, Modern History and History Extension. Student B may also take English Advanced, English Ext. 1, Legal Studies, Maths Ext. 1 and Physics, and so on. The scaling process takes the HSC marks of all the courses taken by all these 3,454 students as a sample. Thus this sample contains all the HSC results of all the students taking Mathematics Extension 2, and hence represents the strength of performance of all the candidates in this course. The mean and the standard deviation of this sample are then determined as the scaled mean and scaled standard deviation of Mathematics Extension 2. In conjunction, the scaled maximum mark and various percentiles are also determined from the sample.
Following is an extract of some ATAR courses from Table A3 in the Report on the Scaling of the 2012 NSW High School Certificate, which shows their calculated scaled means, standard deviations, maximum marks and various percentiles.

1. scaled mean - As students taking harder courses tend to perform better in their other courses, HSC marks in the sample for harder courses like Mathematics Extension 2 is expected to be relatively higher and so does the scaled mean. Hence, the larger the scaled mean, the better the scaled marks will be on average.
2. scaled standard deviation - The standard deviation indicates the spread of marks which deviates from the mean. Marks in courses with a low scaled standard deviation are generally closer to the scaled mean. Hence, there is less variation in scaled marks in different percentiles (e.g. in Mathematics Extension 2, scaling for P50 is not too different from that of P90. Student with a fair ranking can also have a reasonably good scaled mark). On the other hand, marks in courses with a high scaled standard deviation are more wide-spread. Only marks in higher percentile are better scaled while those in lower percentile will be poorly scaled (e.g. in Modern History, scaling in P50 is much poorer than that of P90. Student has to achieve a high ranking in order to have a good scaled mark)
Scaling individual HSC marks
Alex's HSC mark for Economics is 89 which is 44.5 on a 1-unit basis, and falls close to the 90-percentile (P90). His scaled mark is then expected to be close to 42.6. The scaling process may have calculated his scaled mark to be 42.5. Likewise, scaled marks for Alex's other courses are calculated in similar manner. Alex's scaled marks would have been calculated from the corresponding HSC marks as follows:
HSC scaled
Course mark 1-unit mark
Economics 89 44.5 42.5
Englisg Advanced 90 45.0 41.8
Maths Ext. 1 78 39.0 37.2
Maths Ext. 2 84 42.0 42.8
Modern History 75 37.5 24.9
History Ext. 47 47.0 45.4
In like manner, all students' HSC marks are scaled accordingly and ready to be aggregated for the determination of ATARs.
Wednesday, August 14, 2013
HSC and ATAR (7 of 10) - Determining the ATAR
Not all HSC courses contribute to the calculation of ATAR. Only Board Developed courses (Category A and Category B) can contribute to ATAR (hence called ATAR courses). To be eligible for an ATAR, a student must complete satisfactorily at least 10 units of ATAR courses including at least:
. 2 units of English
. 8 units of Category A courses
. 3 ATAR (Category A or B) of 2 units or greater
. 4 subjects
The ATAR is calculated based on the aggregate of 10 units of ATAR courses comprising:
. the best 2 units of English
. the best 8 units from the remaining units, which can include up to 2 units of Category B courses.
The process of determinating the ATAR is as follows:
ATAR courses: HSC mark
|
scaling
|
scaled mark
|
sum all ATAR-eligible courses
|
aggregate
|
rank among all ATAR-eligible students
|
ATAR percentile
|
rank among Year 7 cohort
|
Year 7 percentile
|
truncate
|
ATAR
We shall walk through the process in details with Alex as an example.
. 2 units of English
. 8 units of Category A courses
. 3 ATAR (Category A or B) of 2 units or greater
. 4 subjects
The ATAR is calculated based on the aggregate of 10 units of ATAR courses comprising:
. the best 2 units of English
. the best 8 units from the remaining units, which can include up to 2 units of Category B courses.
The process of determinating the ATAR is as follows:
ATAR courses: HSC mark
|
scaling
|
scaled mark
|
sum all ATAR-eligible courses
|
aggregate
|
rank among all ATAR-eligible students
|
ATAR percentile
|
rank among Year 7 cohort
|
Year 7 percentile
|
truncate
|
ATAR
We shall walk through the process in details with Alex as an example.
Sunday, August 4, 2013
HSC and ATAR (6 of 10) - The HSC Result
For each couse undertaken for HSC, a student received 3 marks: the examination mark (after alignment), the assessment mark (after moderation and alignment) and the HSC mark. The HSC mark is simply the average of the examination mark and the assessment mark to provide a 50-50 weighting between the two. The HSC mark then determines the performance band into which a student's performance falls.
An example of Alex's HSC result as reported in his Record of Achievement is as follows:
Exam Assessment HSC Performance
Course Unit mark mark mark band
Economics 2 85/100 92/100 89 5
English Advanced 2 83/100 96/100 90 6
Maths Ext. 1 2 75/100 80/100 78 4
Maths Ext. 2 2 80/100 88/100 84 5
Modern History 2 74/ 100 76/100 75 4
History Ext. 1 46/50 47/50 47 E4
As an illustration, Alex's HSC mark (89) for Economics is the average of the reported examination mark (85) and the reported assessment mark (92). The HSC mark (89) falls in the mark range of 80-90 and hence falls in performance band 5.
If the HSC courses are eligible for an ATAR, the University Admission Centre (UAC) will calculate the ATAR for the student and use it as the ranking among all applicants for selection for admission in particular courses in particular university.
An example of Alex's HSC result as reported in his Record of Achievement is as follows:
Exam Assessment HSC Performance
Course Unit mark mark mark band
Economics 2 85/100 92/100 89 5
English Advanced 2 83/100 96/100 90 6
Maths Ext. 1 2 75/100 80/100 78 4
Maths Ext. 2 2 80/100 88/100 84 5
Modern History 2 74/ 100 76/100 75 4
History Ext. 1 46/50 47/50 47 E4
As an illustration, Alex's HSC mark (89) for Economics is the average of the reported examination mark (85) and the reported assessment mark (92). The HSC mark (89) falls in the mark range of 80-90 and hence falls in performance band 5.
If the HSC courses are eligible for an ATAR, the University Admission Centre (UAC) will calculate the ATAR for the student and use it as the ranking among all applicants for selection for admission in particular courses in particular university.
Saturday, July 27, 2013
HSC and ATAR (5 of 10) - Moderation of Assessment Marks
Assessment Mark
For each HSC course Alex undertakes in Year 12, he completes the required assessment tasks as mandated by the school. Once the assessments are complete, the school submits the total assessment mark (called raw assessment mark) together with the rank order in his year group for each course to the Board of Studies (BOS):
Raw
Course Unit assessment mark Rank
Economics 2 80/100 15
English Advanced 2 90/100 1
Maths Ext. 1 2 75/100 8
Maths Ext. 2 2 85/100 4
Modern History 2 72/100 38
History Ext. 1 45/50 2
As different schools may use different programs of assessment tasks and have slightly different marking criteria, all school-submitted assessment marks are moderated by BOS in order to maintain fairness across schools. While the raw assessment marks might be influenced by individual schools, the HSC examination is used as a common scale to allow schools to be compared fairly as all students sit together in the open examination. The moderation process re-distributes the total raw examination marks of each HSC course obtained by the individual school during the HSC examination to all its students according to the students' performance in school (i.e. according to the ranking and their relative performance of each student in the school assessment). The process may sound complicated, but let's illustrate using Alex and his High School in one HSC course as an example.
Assuming Alex's class in Year 12 in his High School has 6 students (just hypothetical for simplicity), their raw assessment marks together with the rank order in the English Advanced course are submitted by the school. Their raw examination marks in the English Advanced course are also extracted from the HSC examination:
Raw Raw
Course assessment mark Rank examination mark Rank
Alex 90 1 76 3
Ben 78 2 92 1
Charles 75 3 80 2
Dylan 58 4 60 4
Edward 55 5 50 6
Frank 40 6 51 5
Total 396 409
Mean 66 68
The moderation process works as follows:
1. the top raw assessment mark is adjusted to equal to the top raw examination mark (92).
2. the bottom raw assessment mark is adjusted to equal to the bottom raw examination mark (50)
3. the mean of the raw assessment marks of the school is adjusted to equal to the mean of the raw examination mark of the school (68)
As such, the moderated assessment marks for the English Advanced course of Alex's school are as follows:
Moderated
assessment mark Rank
Alex 92 1
Ben 77 2
Charles 74 3
Dylan 59 4
Edward 57 5
Frank 50 6
Total 409
Mean 68
Note that:
1. the total moderated assessment mark of the school is equal to the total raw examination mark of the school (409), i.e. the total raw examination marks of the school is re-distributed as the moderated assessment marks of the school
2. the rank order of each student in the school assessment is maintained, i.e. Alex remains 1st and Ben remains 2nd, and so on in the raw assessment is the same as those in the moderated assessment
3. the relative performance between students is also maintained, i.e. the relative gaps between Alex/Ben, Ben/Charles etc in the raw assessment are the same as those in the moderated assessment.
The process is then repeated for all other courses Alex undertakes, and Alex's moderated assessment marks are calculated as follows:
Moderated
Course Unit assessment mark
Economics 2 85/100
English Advanced 2 92/100
Maths Ext. 1 2 74/100
Maths Ext. 2 2 80/100
Modern History 2 70/100
History Ext. 1 44/50
After moderation, the school assessments (the assessment marks) are now on the same scale as the HSC examination (the examination marks), and are deemed fair across all schools. To cater for the difference in students' performance in different year, the moderated assessment marks are further aligned to the performance bands according to the current year's cut-offs similar to the alignment process of the raw examination marks. Alex's reported assessment marks are then calculated as follows:
Reported
Course Unit assessment mark
Economics 2 92/100
English Advanced 2 96/100
Maths Ext. 1 2 80/100
Maths Ext. 2 2 88/100
Modern History 2 76/100
History Ext. 1 47/50
For each HSC course Alex undertakes in Year 12, he completes the required assessment tasks as mandated by the school. Once the assessments are complete, the school submits the total assessment mark (called raw assessment mark) together with the rank order in his year group for each course to the Board of Studies (BOS):
Raw
Course Unit assessment mark Rank
Economics 2 80/100 15
English Advanced 2 90/100 1
Maths Ext. 1 2 75/100 8
Maths Ext. 2 2 85/100 4
Modern History 2 72/100 38
History Ext. 1 45/50 2
As different schools may use different programs of assessment tasks and have slightly different marking criteria, all school-submitted assessment marks are moderated by BOS in order to maintain fairness across schools. While the raw assessment marks might be influenced by individual schools, the HSC examination is used as a common scale to allow schools to be compared fairly as all students sit together in the open examination. The moderation process re-distributes the total raw examination marks of each HSC course obtained by the individual school during the HSC examination to all its students according to the students' performance in school (i.e. according to the ranking and their relative performance of each student in the school assessment). The process may sound complicated, but let's illustrate using Alex and his High School in one HSC course as an example.
Assuming Alex's class in Year 12 in his High School has 6 students (just hypothetical for simplicity), their raw assessment marks together with the rank order in the English Advanced course are submitted by the school. Their raw examination marks in the English Advanced course are also extracted from the HSC examination:
Raw Raw
Course assessment mark Rank examination mark Rank
Alex 90 1 76 3
Ben 78 2 92 1
Charles 75 3 80 2
Dylan 58 4 60 4
Edward 55 5 50 6
Frank 40 6 51 5
Total 396 409
Mean 66 68
The moderation process works as follows:
1. the top raw assessment mark is adjusted to equal to the top raw examination mark (92).
2. the bottom raw assessment mark is adjusted to equal to the bottom raw examination mark (50)
3. the mean of the raw assessment marks of the school is adjusted to equal to the mean of the raw examination mark of the school (68)
4. basing on 1-3 and the statistics of all the raw examination marks of all the students in the school, a concave-up quadratic curve for the moderated assessment marks of all the students in the school is established:

5. individual student's moderated assessment marks are then determined (can be read off) from the above quadratic curve from their raw assessment marks
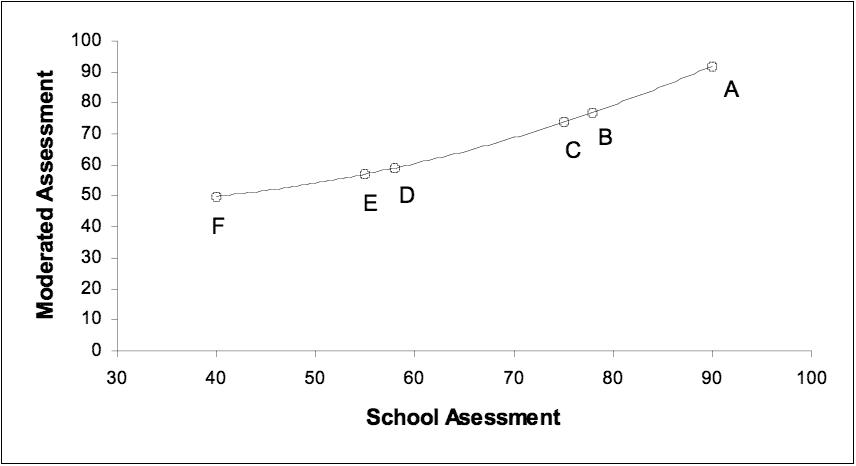
5. individual student's moderated assessment marks are then determined (can be read off) from the above quadratic curve from their raw assessment marks
As such, the moderated assessment marks for the English Advanced course of Alex's school are as follows:
Moderated
assessment mark Rank
Alex 92 1
Ben 77 2
Charles 74 3
Dylan 59 4
Edward 57 5
Frank 50 6
Total 409
Mean 68
Note that:
1. the total moderated assessment mark of the school is equal to the total raw examination mark of the school (409), i.e. the total raw examination marks of the school is re-distributed as the moderated assessment marks of the school
2. the rank order of each student in the school assessment is maintained, i.e. Alex remains 1st and Ben remains 2nd, and so on in the raw assessment is the same as those in the moderated assessment
3. the relative performance between students is also maintained, i.e. the relative gaps between Alex/Ben, Ben/Charles etc in the raw assessment are the same as those in the moderated assessment.
The process is then repeated for all other courses Alex undertakes, and Alex's moderated assessment marks are calculated as follows:
Moderated
Course Unit assessment mark
Economics 2 85/100
English Advanced 2 92/100
Maths Ext. 1 2 74/100
Maths Ext. 2 2 80/100
Modern History 2 70/100
History Ext. 1 44/50
After moderation, the school assessments (the assessment marks) are now on the same scale as the HSC examination (the examination marks), and are deemed fair across all schools. To cater for the difference in students' performance in different year, the moderated assessment marks are further aligned to the performance bands according to the current year's cut-offs similar to the alignment process of the raw examination marks. Alex's reported assessment marks are then calculated as follows:
Reported
Course Unit assessment mark
Economics 2 92/100
English Advanced 2 96/100
Maths Ext. 1 2 80/100
Maths Ext. 2 2 88/100
Modern History 2 76/100
History Ext. 1 47/50
Subscribe to:
Posts (Atom)

