Alex's HSC result as reported in his Record of Achievement is as follows:
Exam Assessment HSC Performance
Course Unit mark mark mark band
Economics 2 85/100 92/100 89 5
English Advanced 2 83/100 96/100 90 6
Maths Ext. 1 2 75/100 80/100 78 4
Maths Ext. 2 2 80/100 88/100 84 5
Modern History 2 74/ 100 76/100 75 4
History Ext. 1 46/50 47/50 47 E4
Marks in different courses are usually not comparable due different nature of the courses. Let's get some idea from Alex's HSC marks and his performance against other students in his Economics and Mathematics Extension 2 courses (from Alex's HSC result and the statistics on percentiles in Table A3 in the Report of the Scaling of the 2012 NSW High School Certificate):
HSC
Course Unit mark Percentile
Economics 2 89 90
Maths Ext. 2 2 84 48
As can be seen, while Alex's HSC marks for Economics and Mathematics Extension 2 only differ by 5 (89 vs 84), his position in Economics is much higher than that in Mathematics Extension 2 (90-percentile vs 48-percentile) when compared against other students. (i.e.Despite similar marks, Alex's performance in Economics is better than 90% of all other students in Economics while his performance in Mathematics Extension 2 is only better than 48% of all other students in this course). This implies that most students taking the Mathematics Extension 2 course perform very well while those taking Economics do less well comparatively. In other words, the strength of performance of the course candidature in Mathematics Extension 2 is higher than that of Economics. As such, similar marks in different courses do not necessarily mean similar performance due differences in strength of students in each course. As the ultimate determination of ATAR is to rank the students according to their academic performance (i.e. academic strength) for selection to universities, marks from different courses cannot be simply added together as an aggregate to derive the ATAR. Some form of adjustment called scaling must be carried out to convert marks from different courses (HSC marks) into marks in a common scale (scaled marks) based on the strength of performance of the course candidature before they can be compared and added. As an analogy, we cannot add apple to orange. But instead, we can convert them into a common scale (called fruit) before meaningful addition can take place.
Calculating scale means and standard deviations of ATAR courses
The scaling process first converts the HSC marks of all courses to marks on a 1-unit basis. Then it calculates the scaled mean and scaled standard deviation of each course to reflect the strength of the course candidature.
Take Mathematics Extension 2 as an example. There are 3,454 candidates in 2012. Each of these 3,454 students may take a number of other courses in the HSC examination. e.g. Student A may also take Economics, English Advanced, Maths Ext. 1, Modern History and History Extension. Student B may also take English Advanced, English Ext. 1, Legal Studies, Maths Ext. 1 and Physics, and so on. The scaling process takes the HSC marks of all the courses taken by all these 3,454 students as a sample. Thus this sample contains all the HSC results of all the students taking Mathematics Extension 2, and hence represents the strength of performance of all the candidates in this course. The mean and the standard deviation of this sample are then determined as the scaled mean and scaled standard deviation of Mathematics Extension 2. In conjunction, the scaled maximum mark and various percentiles are also determined from the sample.
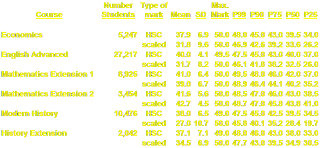
Following is an extract of some ATAR courses from Table A3 in the Report on the Scaling of the 2012 NSW High School Certificate, which shows their calculated scaled means, standard deviations, maximum marks and various percentiles.
It should be noted that:
1. scaled mean - As students taking harder courses tend to perform better in their other courses, HSC marks in the sample for harder courses like Mathematics Extension 2 is expected to be relatively higher and so does the scaled mean. Hence, the larger the scaled mean, the better the scaled marks will be on average.
2. scaled standard deviation - The standard deviation indicates the spread of marks which deviates from the mean. Marks in courses with a low scaled standard deviation are generally closer to the scaled mean. Hence, there is less variation in scaled marks in different percentiles (e.g. in Mathematics Extension 2, scaling for P50 is not too different from that of P90. Student with a fair ranking can also have a reasonably good scaled mark). On the other hand, marks in courses with a high scaled standard deviation are more wide-spread. Only marks in higher percentile are better scaled while those in lower percentile will be poorly scaled (e.g. in Modern History, scaling in P50 is much poorer than that of P90. Student has to achieve a high ranking in order to have a good scaled mark)
Scaling individual HSC marks
Alex's HSC mark for Economics is 89 which is 44.5 on a 1-unit basis, and falls close to the 90-percentile (P90). His scaled mark is then expected to be close to 42.6. The scaling process may have calculated his scaled mark to be 42.5. Likewise, scaled marks for Alex's other courses are calculated in similar manner. Alex's scaled marks would have been calculated from the corresponding HSC marks as follows:
HSC scaled
Course mark 1-unit mark
Economics 89 44.5 42.5
Englisg Advanced 90 45.0 41.8
Maths Ext. 1 78 39.0 37.2
Maths Ext. 2 84 42.0 42.8
Modern History 75 37.5 24.9
History Ext. 47 47.0 45.4
In like manner, all students' HSC marks are scaled accordingly and ready to be aggregated for the determination of ATARs.
Friday, August 23, 2013
Subscribe to:
Post Comments (Atom)


No comments:
Post a Comment